What are Event-Relationship Diagrams?
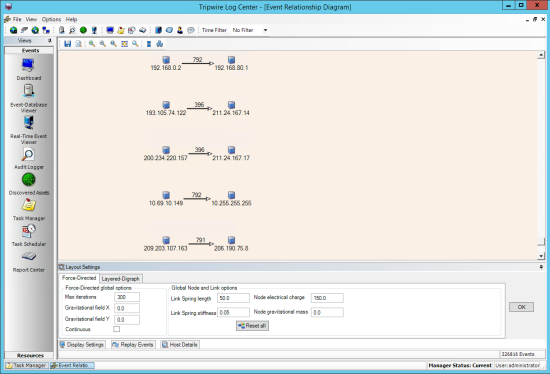
An Event-Relationship Diagram (see Figure 46) depicts the series of communications and 'forces' between systems involved in two or more Events. With the Replay Events feature, you can also run a visual replay of the sequence depicted by a diagram.
Tripwire LogCenter provides two formats for Event-Relationship Diagrams: Force-Directed Diagrams and Layered-Digraph Diagrams. Event-Relationship Diagrams can be generated from a number locations in the TLC Console, including the Task Manager and the Event-Database Viewer. In a diagram's Layout Settings tab, you can specify the type of diagram and configure the settings for the diagram.
For more information, see Generating an Event-Relationship Diagram.
Figure 46. Example of an Event-Relationship Diagram
