 Event-Database Viewer.
 In the Dashboard and the Event-Database Viewer, you can create, configure, and review Database Layouts with information about the Events in an Event Database. For more information, see What are the Dashboard, Manager Layouts, and Database Layouts?.
To work with Database Layouts in the Event-Database Viewer:
| 1. | In the side bar, select Events >Event-Database Viewer. |
| 2. | In the side bar of the Event-Database Viewer, expand the options under the Event Database and select Event Overview. |
To work with Database Layouts in the Dashboard:
| 1. | In the side bar, select Events > Dashboard. Dashboard. |
| 2. | From the Display drop-down, select an Event-Management Database. |
To create, configure, and review Database Layouts:
| 1. | Open the Dashboard or Event-Database Viewer, as described above. |
| 2. | To open a different Database Layout, select the layout from the Layout drop-down. |
To create a new Database Layout:
| a. | From the Display drop-down, select the Event-Management Database for which the new layout will display data. |
| b. | From the Layout drop-down, select New Layout. |
| c. | Click Save. Save. |
| d. | In the Save As dialog, enter a name for the layout and click Save. |
To add a panel (see Table 115):
| a. | Click Add and select a type of Layout Panel. Add and select a type of Layout Panel. |
| b. | Click Refresh to populate the panel with data. Refresh to populate the panel with data. |
To move a panel, drag-and-drop the panel to another position in the layout.
To remove a panel, click the X in the upper-right corner of the panel.
|
Tip |
When you add, move, or remove panels in a layout, click To customize the appearance of a Time Graph Panel or Top Graph Panel (see Table 115), right-click the panel. |
|---|
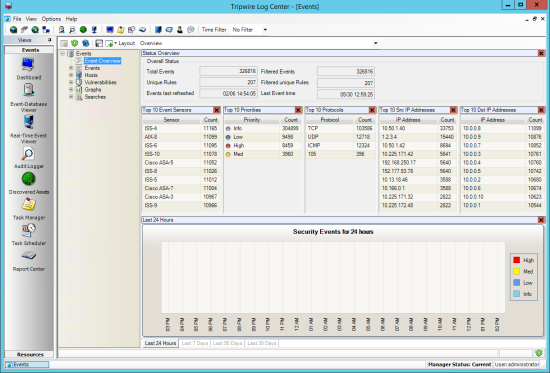
Figure 55. A Database Layout in the Event-Database Viewer
|
Panel |
Description |
|---|---|
|
Top Graph Panels |
For a single Event field, these panels present a pie chart illustrating the Top 10 most common values in the database's Events. For field descriptions, click here. |
|
Time Graph Panels |
For a specific period of time, these panels display a graph showing the number of Events saved in the Event Database. |
|
Map Panels |
These panels display a global map showing the locations of any IP Tags that apply to the IP addresses in the properties of Events. |
|
Text Panels |
For a single Event field, these panels rank the Top 10 most common values in the properties of the database's Events. For field descriptions, click here. |
|
Status Overview Panel |
Total Events. The total number of Events in the Event Database. Filtered Events. The number of Events filtered from the panel by the Global Time Filter. Total unique Events. The total number of Normalization Rules that normalized Events in the database. Filtered unique Events. The number of Normalization Rules with Events filtered from the panel by the Global Time Filter. Events last refreshed. The date and time when the Event-Database Viewer last received Events from the Normalization Engine and/or Correlation Engine. Last Event time. The date and time when the last Event was added to the Event Database. |