A component of the TLC Console (see TLC Console Views and Components), the Dashboard presents information about a Manager or Event-Management Database in a Layout, a customizable configuration of panels containing fields, tables, and/or graphs.
A Manager Layout presents information about 1) a selected Manager’s system resources and configuration, and 2) the log messages collected by the Manager's Collectors.
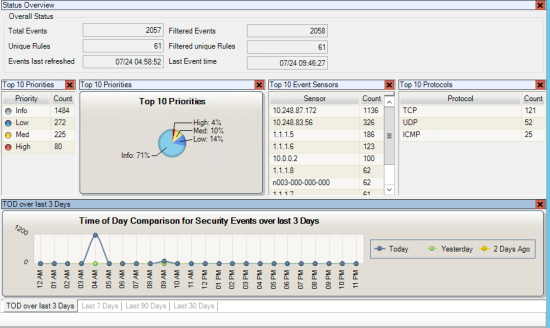
A Database Layout (see Figure 37) presents information about the Events in a selected Event-Management Database.
|
Note |
You can also view and configure Database Layouts in the Event-Database Viewer (see Working with Database Layouts). |
|---|
Table 29 describes some common types of Layout Panels that may be added to a Layout. In the Task Manager, you can create custom Layout Panels (see Working with Layout-Panel Tasks).
For more information, see:
|
Type |
Description |
|---|---|
|
(Manager Layouts only) Displays a diagram of the Log Sources, Collectors, Managers, Audit Loggers, Correlation Engines, and Event-Management Databases in your TLC environment. |
|
|
(Database Layouts only) Displays the geographic locations of IP addresses on a map. |
|
|
Presents data in a table. |
|
|
Presents a timeline of log messages or Events in a graph. |
|
|
(Database Layouts only) Displays the Top N items in a graph or chart. |
Figure 37. Example of a Dashboard Layout
